

US PMI Data – What to Expect – 23.9.25
PMIs land Tuesday, 23 Sep 2025 at 14:45 UK. We expect a resilient consumer, tentative factory momentum, split regional signals, tariff pressure on prices, and a cooler jobs pulse. This article lays out what to watch and how markets might move. Our base case triangulates the recent macro tape (resilient retail sales, modest factory uptick), mixed regional manufacturing surveys (Philadelphia strength vs. Empire softness), tariff-linked price pressures, and a labor market that’s cooling at the margin.
Our base case triangulates the recent macro tape (resilient retail sales, modest factory uptick), mixed regional manufacturing surveys (Philadelphia strength vs. Empire softness), tariff-linked price pressures, and a labor market that’s cooling at the margin.
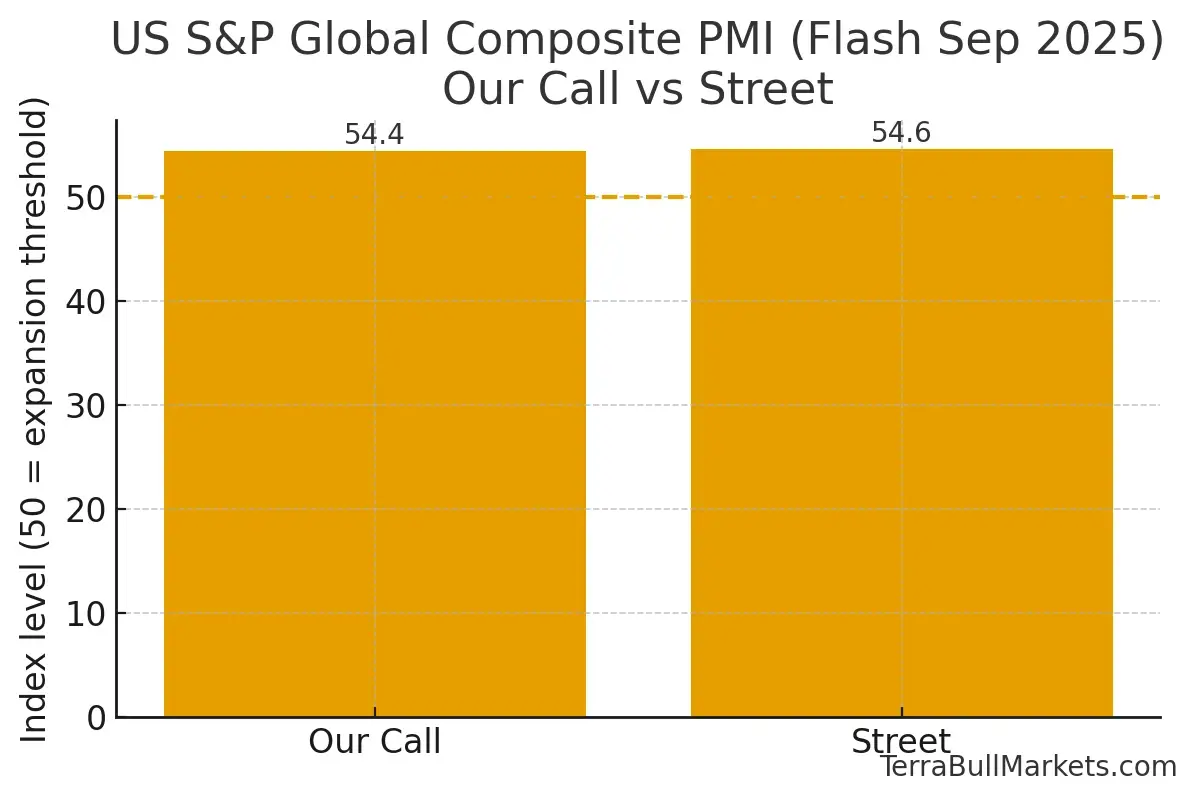
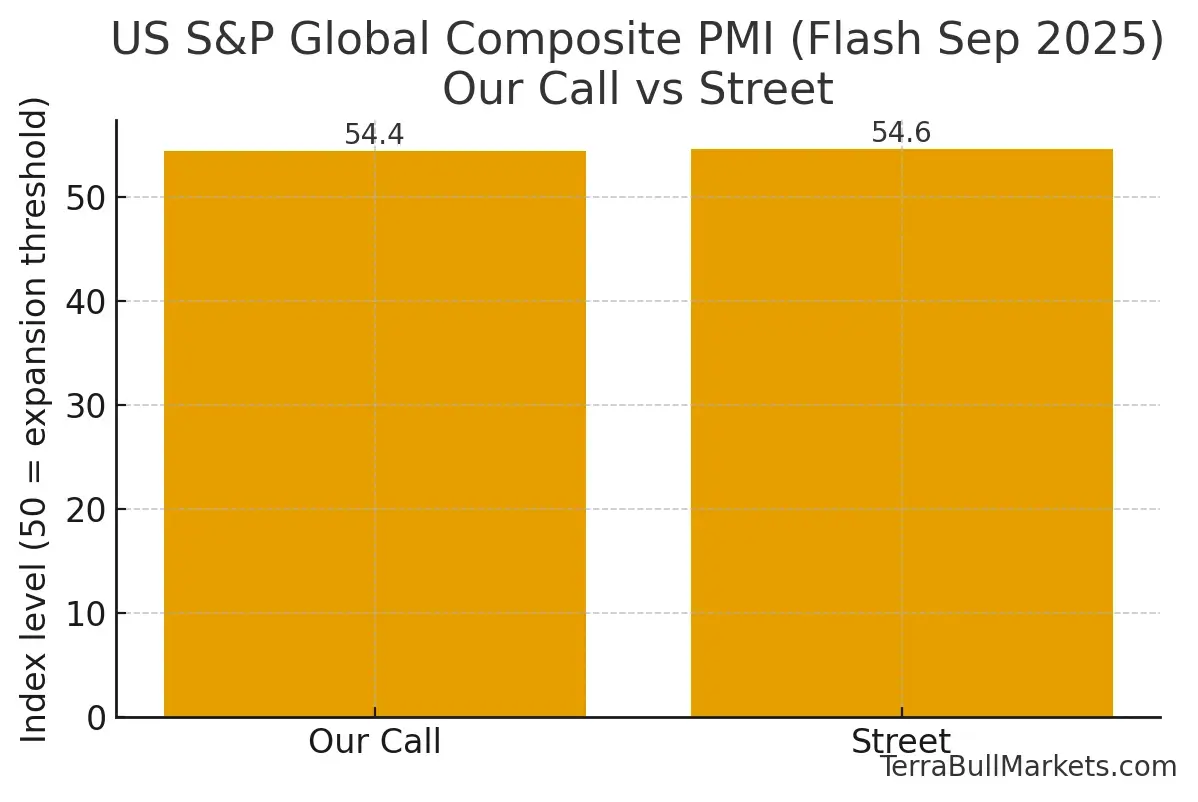
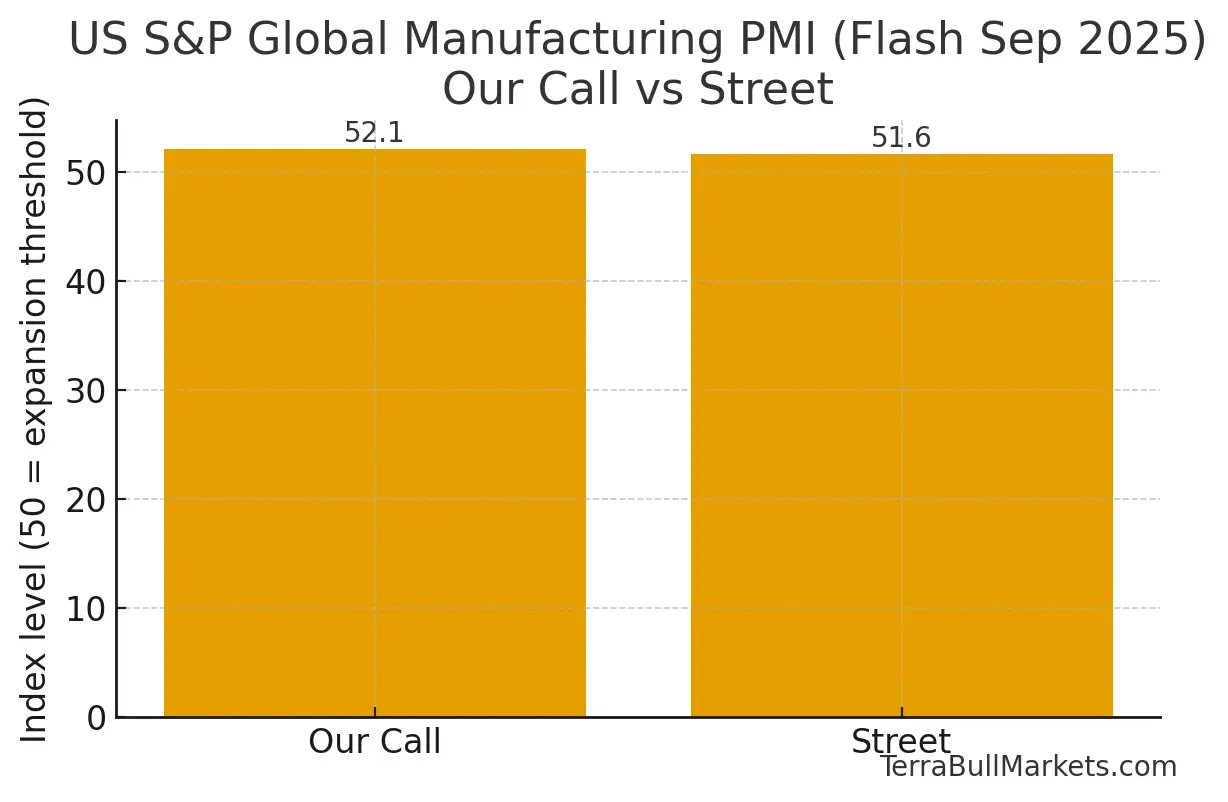
We expect the Composite PMI to come in at 54.4 (slightly below the 54.6 consensus) and Manufacturing at 52.1 (a touch above the 51.6 consensus).
The balance of risks hinges on new orders/backlogs and prices charged: firmer demand plus sticky prices would keep growth momentum intact and lean hawkish at the margin; any payback in factory activity or softer price dynamics would signal a gentler expansion.
Our Call:
-
Composite PMI (flash, Sep): I lean 54.3–54.5 (my point: 54.4).
Implication: Slight miss vs consensus 54.6, but a touch above your 54.1. -
Manufacturing PMI (flash, Sep): I lean 51.8–52.5 (my point: 52.1).
Implication: Small beat vs consensus 51.6; broadly in line with your 52.0.
Why:
1) Momentum check since August
-
August PMI backdrop: US activity accelerated to the year-to-date high on the flash print, led by a sharp factory rebound and ongoing services growth; S&P flagged tariff-driven price pressures and the biggest rise in backlogs since 2022. Final August services was 54.5 and the composite was revised to ~54.6 (from 55.4 flash).
-
Hard data stayed supportive: Industrial production for August rose 0.1% m/m with manufacturing +0.2% (autos +2.6%), consistent with factories running a bit hotter than earlier in the summer. Retail sales surprised at +0.6% m/m in August, showing resilient demand.
2) Manufacturing pulse into September (flash)
-
Regional surveys mixed: Empire State flipped back to contraction (-8.7, orders -19.6) while Philly Fed jumped to its highest since Jan (23.2, orders 12.4). That mix argues for slower but still-positive nationwide factory momentum on S&P’s lens
-
PMI vs ISM gap matters: ISM manufacturing stayed in contraction (48.7) in Aug even as S&P Manufacturing hit 53.0 (best since 2022). Methodology differences (coverage, sample, questions) explain why S&P has tracked private-sector output more closely at turning points; I’d fade the ISM-style gloom here.
-
Tariff & inventory dynamics: S&P highlighted record stock-building and tariff pass-through lifting prices in Aug — helpful for September levels, but some front-loading likely cools a touch. Net: low-52s feels right.
3) Services & composite drivers
-
Services slowed a bit in Aug (final 54.5 from 55.7), so the base level for the composite into Sep is already mid-54s. ISM services improved to 52.0 but its employment subindex contracted (46.5), consistent with a cooler hiring backdrop. That combination argues for solid activity but slightly softer breadth in Sep’s flash.
-
Labor market is softening at the margin: Jobless claims spiked then fell back to 231k last week; payroll growth in Aug was weak (~22k) and unemployment is higher. That tends to cap services exuberance even as consumers still spend.
-
Prices still sticky: CPI rose to 2.9% y/y in Aug and S&P signalled the steepest output price rise in ~3 years on tariffs. A firm prices-charged reading tomorrow could keep the composite from slipping too far even if volumes cool.
4) The tariff channel (near-term)
Multiple new/steeper US tariffs in 2025 (incl. doubled Section 232 steel/aluminum) are filtering through costs and supply chains. S&P explicitly linked higher costs and selling prices to tariffs; IMF and press coverage also flag upside inflation risks and confidence headwinds. Net effect for PMIs: price indices up, demand steady-to-slower, especially in trade-exposed niches.
What would push the print off my base case?
Upside (Composite >55 / Mfg ≥52.5):
-
Services new orders/backlogs re-accelerate (tourism, tech/professional services), and factories keep post-tariff stock-building elevated. Watch for strong output + prices charged combo.
Downside (Composite ≤54 / Mfg ≤51.5):
-
Evidence that August’s factory pop was front-loaded (Empire-style weakness broadens), and services hiring softness feeds into output. A cooler prices signal would amplify growth concerns given the softer labor tape.
Market angle you can trade around
-
Hotter growth and sticky prices (Composite >55 and strong prices): pushes yields/DXY higher, USD-positive (esp. vs JPY & CHF) as rate-cut odds for Oct are questioned at the margin.
-
Cooler growth with benign prices (Composite ≤54, softer prices): supports duration and USD-negative vs EUR/GBP, reinforcing the “Fed cuts still live” narrative given the softer jobs backdrop.
Housekeeping & Data Notes
-
Release time is 09:45 ET / 14:45 UK for the US S&P Global flash PMIs. (Your sheet shows 13:30 UK — that slot is for various 08:30 ET US data, not the S&P flash PMI.)
-
“Previous” reference: The most recent final US Composite PMI was ~54.6 (Aug); 55.1 was July. Manufacturing previous 53.0 (Aug) is correct.
In Conclusion
Netting it all out, the U.S. private-sector pulse should remain expansionary but not accelerating: a Composite in the mid-54s and Manufacturing just above 52 is consistent with steady output, mixed hiring, and still-elevated pricing power tied to tariffs. For markets, a hotter growth + sticky prices mix argues higher yields/stronger USD (notably vs. JPY/CHF), while a cooler growth + benign prices outcome supports duration and softens the USD (especially against EUR/GBP). Into the release, prioritize the prices charged, new orders, and employment sub-indices for confirmation, and be ready to fade knee-jerk moves if the headline diverges from the internals.
For similar Forex Markets news please visit our Markets News page.
Please visit our Disclaimer page.
Disclaimer
Information on these pages contains forward-looking statements that involve risks and uncertainties. Markets and instruments profiled on this page are for informational purposes only and should not in any way come across as a recommendation to buy or sell in these assets.
TerraBullMarkets.com does not in any way guarantee that this information is free from mistakes, errors, or material misstatements. It also does not guarantee that this information is of a timely nature. Investing in Open Markets or any financial instrument involves a great deal of risk, including the loss of all or a portion of your investment, as well as emotional distress.
All risks, losses and costs associated with investing, including total loss of principal, are your responsibility. The views and opinions expressed in this article are those of the authors and do not necessarily reflect the official policy or position of TerraBullMarkets.com nor any of its advertisers. The author will not be held responsible for information that is found at the end of links posted on this page.
TerraBullMarkets.com and the author do not provide personalized recommendations. The author makes no representations as to the accuracy, completeness, or suitability of this information. TerraBullMarkets.com and the author will not be liable for any errors, omissions or any losses, injuries or damages arising from this information and its display or use. Errors and omissions excepted.
The author and TerraBullMarkets.com are not registered investment advisors and nothing in this article is intended to be investment advice.